Values of securities held
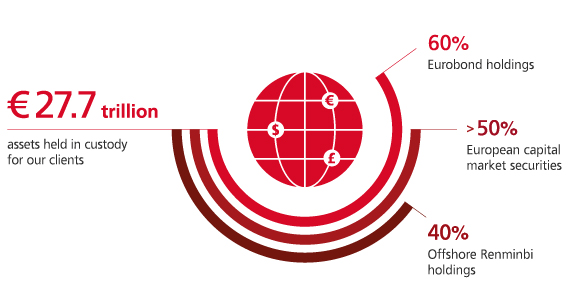
(in € trillion)1
| 2016 |
27.7 |
| 2015 |
27.5 |
| 2014 |
26.0 |
| 2013 |
24.2 |
| 2012 |
23.0 |
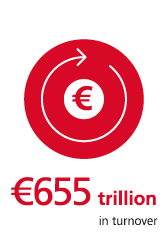
Turnover
(in € trillion)1
| 2016 |
655.4 |
| 2015 |
669.5 |
| 2014 |
623.3 |
| 2013 |
572.8 |
| 2012 |
541.6 |
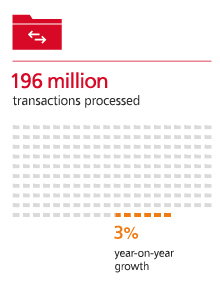
Number of netted transactions
(in millions)
| 2016 |
195.9 |
| 2015 |
190.7 |
| 2014 |
181.6 |
| 2013 |
170.4 |
| 2012 |
158.9 |
Average daily collateral provision outstanding (in € billion)2
| 2016 |
1072.5 |
| 2015 |
1,067.7 |
| 2014 |
886.9 |
| 2013 |
787.3 |
| 2012 |
700.6 |
Operating income
(in € million)
| 2016 |
1,161.9 |
| 2015 |
1,130.2 |
| 2014 |
1,039.6 |
| 2013 |
1,016.0 |
| 2012 |
1,028.4 |
Operating profit before impairment and taxation
(in € million)
| 2016 |
411.0 |
| 2015 |
400.6 |
| 2014 |
359.2 |
| 2013 |
352.7 |
| 2012 |
327.9 |
Shareholders' equity
(in € million)
| 2016 |
3,560 |
| 2015 |
3,476 |
| 2014 |
3,244.5 |
| 2013 |
3,212.5 |
| 2012 |
3,184.5 |
Dividend per share
(in €)
| 2016 |
37.0 |
| 2015 |
36.3 |
| 2014 |
31.5 |
| 2013 |
29.6 |
| 2012 |
25.4 |
|
Turnover |
Values of securities held |
Number of netted transactions |
| 2016 |
€451.7 trillion |
€12.7 trillion |
84.1 million |
| change from 2015 |
+2.1% |
+2.5% |
+1.0% |
|
Turnover |
Values of securities held |
Number of netted transactions |
| 2016 |
€122.8 trillion |
€5.8 trillion |
59.8 million |
| change from 2015 |
-13.8% |
-5.2% |
+8.3% |
|
Turnover |
Values of securities held |
Number of netted transactions |
| 2016 |
€1.0 trillion |
€0.2 trillion |
2.4 million |
| change from 2015 |
+2.0% |
-12.8% |
-3.6% |
|
Turnover |
Values of securities held |
Number of netted transactions |
| 2016 |
€62.9 trillion |
€6.3 trillion |
23.2 million |
| change from 2015 |
-6.7% |
+3.4% |
-3.3% |
|
Turnover |
Values of securities held |
Number of netted transactions |
| 2016 |
€4.7 trillion |
€1.0 trillion |
5.9 million |
| change from 2015 |
-3.8% |
+1.3% |
-4.7% |
|
Turnover |
Values of securities held |
Number of netted transactions |
| 2016 |
€0.6 trillion |
€0.3 trillion |
7.1 million |
| change from 2015 |
-1.8% |
+9.9% |
+4.1% |
|
Turnover |
Values of securities held |
Number of netted transactions |
| 2016 |
€11.8 trillion |
€1.4 trillion |
13.3 million |
| change from 2015 |
+9.5% |
+0.9% |
+4.9% |
