Values of securities held
(in € trillion)1
| 2015 |
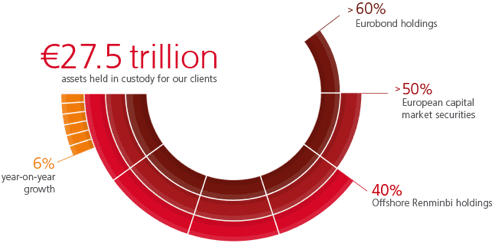
27.5 |
| 2014 |
26.0 |
| 2013 |
24.2 |
| 2012 |
23.0 |
| 2011 |
22.1 |
Turnover
(in € trillion)1
| 2015 |
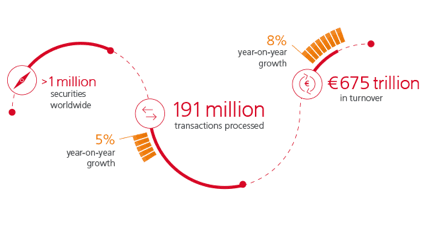
674.7 |
| 2014 |
623.6 |
| 2013 |
572.8 |
| 2012 |
541.6 |
| 2011 |
580.6 |
Number of netted transactions (in millions)
| 2015 |
190.7 |
| 2014 |
181.6 |
| 2013 |
170.4 |
| 2012 |
158.9 |
| 2011 |
163.3 |
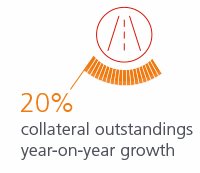
Average daily collateral provision outstanding (in € billion)2
| 2015 |
1,067.7 |
| 2014 |
886.9 |
| 2013 |
787.3 |
| 2012 |
700.6 |
| 2011 |
503.1 |
Operating income
(in € million)
| 2015 |
1,130.2 |
| 2014 |
1,039.6 |
| 2013 |
1,016.0 |
| 2012 |
1,028.4 |
| 2011 |
1,021.8 |
Operating profit before impairment and taxation
(in € million)
| 2015 |
400.6 |
| 2014 |
359.2 |
| 2013 |
352.7 |
| 2012 |
327.9 |
| 2011 |
296.3 |
Shareholders' equity
(in € million)
| 2015 |
3,476 |
| 2014 |
3,244.5 |
| 2013 |
3,212.5 |
| 2012 |
3,184.5 |
| 2011 |
3,010.6 |
Dividend per share
(in €)
| 2015 |
36.3 |
| 2014 |
31.5 |
| 2013 |
29.6 |
| 2012 |
25.4 |
| 2011 |
17.4 |
|
Turnover |
Values of securities held |
Number of netted transactions |
| 2015 |
€442.6 trillion |
€12.4 trillion |
83.3 million |
| change from 2014 |
+12.2% |
+5.3% |
+10.8% |
|
Turnover |
Values of securities held |
Number of netted transactions |
| 2015 |
€147.5 trillion |
€6.1 trillion |
55.3 million |
| change from 2014 |
+3.7 |
+7.9% |
-1.4% |
|
Turnover |
Values of securities held |
Number of netted transactions |
| 2015 |
€0.9 trillion |
€0.3 trillion |
2.5 million |
| change from 2014 |
+32.1% |
+21.3% |
+17.3% |
|
Turnover |
Values of securities held |
Number of netted transactions |
| 2015 |
€67.4 trillion |
€6.1 trillion |
24.0 million |
| change from 2014 |
-5.5% |
+5.5% |
+6.5% |
|
Turnover |
Values of securities held |
Number of netted transactions |
| 2015 |
€4.9 trillion |
€1.0 trillion |
6.2 million |
| change from 2014 |
+12.0% |
-3.9% |
+9.4% |
|
Turnover |
Values of securities held |
Number of netted transactions |
| 2015 |
€0.6 trillion |
€0.3 trillion |
6.8 million |
| change from 2014 |
-0.9% |
+6.9% |
+8.1% |
|
Turnover |
Values of securities held |
Number of netted transactions |
| 2015 |
€10.7 trillion |
€1.4 trillion |
12.6 million |
| change from 2014 |
+13.3% |
+12.2% |
-8.0% |
